America's safest suburbs ranked for 2025

Carbonatix Pre-Player Loader

Audio By Carbonatix

America's safest suburbs ranked for 2025

While costs are often a major factor for families deciding where to settle, safety is another important factor for quality of life. Many households are willing to pay a premium to be in a neighborhood they feel physically safe in, as valuable qualitative benefits may be at stake in establishing a sense of safety — particularly for families with children. But safety trends can change due to economic, legislative, and other factors. For instance, year over year, the median number of violent crimes in the suburbs increased from 198 to 231, while the median number of property crimes across those same suburbs decreased from 733 to 706.

With this in mind, SmartAsset ranked 360 U.S. towns within 45 minutes driving distance of a major city based on the rates of violent crime, property crime, drug overdoses, traffic deaths, and excessive drinking to determine America’s safest suburbs.

Key Findings

  • Lehi, UT ranks as the safest suburb for the second year in a row. Only 9.4% of adults report excessive drinking in Lehi, the only suburb where this figure is less than 10%. Lehi also has the 22nd lowest rate of drug overdose deaths, and ranks relatively well across other safety metrics. The median monthly housing payment in Lehi is $1,881, compared to $125,860 in household income. On the opposite end of Salt Lake City, Layton, UT ranked the 7th safest suburb. Housing is more affordable in Layton at $1,524 per month, but median household income is also lower at $99,188.
  • Two Dallas suburbs earn spots among the top 10. McKinney and Frisco ranked as the 9th and 10th safest suburbs, respectively. Both located in Collins County, they have some of the lowest drug overdose death rates studywide, and also score particularly well for crime. In McKinney, the median monthly housing payment is $2,101, compared to a median household income of $120,273. In Frisco, the figures are slightly higher with median housing payments at $2,389 and household incomes at $146,158.
  • These midwestern suburbs have the lowest crime rates. Scottsburg, IN was the only suburb with no reported violent crimes, and only 10 property crimes were reported by its 7,338 residents. Canal Winchester, OH had the second lowest rate of violent crime with one incident among 9,659 residents, and it also boasted the lowest rate for property crime overall with six reported incidents. Gretna, NE had the third lowest rate of violent crime, with two incidents reported across 9,117 people.
  • Des Moines, IA suburbs have the lowest rate of drug overdose deaths. Compared to the study-wide median of 26.6 drug overdose deaths per 100,000 residents, towns like Ames, IA, report a fraction of that at a rate of 7.7. In Ames, the median monthly housing cost is $1,082, compared to a median household income of $60,102.
  • Boston and New York City suburbs have the lowest traffic deaths. Stop-and-go traffic does have some benefits. Despite wait times getting in and out of the nearby city center, Lexington and Somerville in Middlesex County, MA report an average of 4 vehicular accident deaths per 100,000 people. Similarly, in Hoboken, Edgewater, and Fort Lee, NJ, that figure is 4.4. For comparison, median traffic deaths across 360 suburbs were 10.8 per 100,000 residents.
SmartAsset's ranking of the top suburbs in America where it is the safest.
SmartAsset


Top 20 Safest Suburbs

  1. Lehi, UT
  • Population: 81,039
  • Violent crime per capita: 0.0072
  • Property crime per capita: 0.0158
  • Number of traffic deaths per 100,000 people: 5.6054
  • Number of drug overdose deaths per 100,000 people: 11.8716
  • Percentage of adults reporting excessive drinking: 9.39%
  • Median monthly housing costs: $1,881
  • Median household income: $125,860
  1. Bethesda, MD
  • Population: 67,403
  • Violent crime per capita: 0.0014
  • Property crime per capita: 0.0197
  • Number of traffic deaths per 100,000 people: 5.6211
  • Number of drug overdose deaths per 100,000 people: 14.2443
  • Percentage of adults reporting excessive drinking: 15.28%
  • Median monthly housing costs: $2,848
  • Median household income: $191,348
  1. Great Falls, VA
  • Population: 14,854
  • Violent crime per capita: 0.0004
  • Property crime per capita: 0.0032
  • Number of traffic deaths per 100,000 people: 4.3547
  • Number of drug overdose deaths per 100,000 people: 10.5282
  • Percentage of adults reporting excessive drinking: 18.78%
  • Median monthly housing costs: 4000+
  • Median household income: 250000+
  1. Rockville, MD
  • Population: 67,218
  • Violent crime per capita: 0.0064
  • Property crime per capita: 0.0198
  • Number of traffic deaths per 100,000 people: 5.6211
  • Number of drug overdose deaths per 100,000 people: 14.2443
  • Percentage of adults reporting excessive drinking: 15.28%
  • Median monthly housing costs: $2,262
  • Median household income: $122,384
  1. Dacula, GA
  • Population: 7,135
  • Violent crime per capita: 0.0017
  • Property crime per capita: 0.0062
  • Number of traffic deaths per 100,000 people: 9.3399
  • Number of drug overdose deaths per 100,000 people: 16.0970
  • Percentage of adults reporting excessive drinking: 16.16%
  • Median monthly housing costs: $1,547
  • Median household income: $74,900
  1. Buford, GA
  • Population: 17,611
  • Violent crime per capita: 0.0028
  • Property crime per capita: 0.0092
  • Number of traffic deaths per 100,000 people: 9.3399
  • Number of drug overdose deaths per 100,000 people: 16.0970
  • Percentage of adults reporting excessive drinking: 16.16%
  • Median monthly housing costs: $1,300
  • Median household income: $71,598
  1. Layton, UT
  • Population: 82,512
  • Violent crime per capita: 0.0126
  • Property crime per capita: 0.0267
  • Number of traffic deaths per 100,000 people: 6.4967
  • Number of drug overdose deaths per 100,000 people: 17.2372
  • Percentage of adults reporting excessive drinking: 13.77%
  • Median monthly housing costs: $1,524
  • Median household income: $99,188
  1. Edgewater, NJ
  • Population: 14,544
  • Violent crime per capita: 0.0006
  • Property crime per capita: 0.0142
  • Number of traffic deaths per 100,000 people: 4.3982
  • Number of drug overdose deaths per 100,000 people: 19.2795
  • Percentage of adults reporting excessive drinking: 18.52%
  • Median monthly housing costs: $2,769
  • Median household income: $137,847
  1. McKinney, TX
  • Population: 202,314
  • Violent crime per capita: 0.0059
  • Property crime per capita: 0.0152
  • Number of traffic deaths per 100,000 people: 6.8868
  • Number of drug overdose deaths per 100,000 people: 10.0592
  • Percentage of adults reporting excessive drinking: 18.21%
  • Median monthly housing costs: $2,101
  • Median household income: $120,273
  1. Frisco, TX
  • Population: 210,238
  • Violent crime per capita: 0.0052
  • Property crime per capita: 0.0215
  • Number of traffic deaths per 100,000 people: 6.8868
  • Number of drug overdose deaths per 100,000 people: 10.0592
  • Percentage of adults reporting excessive drinking: 18.21%
  • Median monthly housing costs: $2,389
  • Median household income: $146,158
  1. Gretna, NE
  • Population: 9,117
  • Violent crime per capita: 0.0002
  • Property crime per capita: 0.0060
  • Number of traffic deaths per 100,000 people: 8.1621
  • Number of drug overdose deaths per 100,000 people: 7.9471
  • Percentage of adults reporting excessive drinking: 21.09%
  • Median monthly housing costs: $1,677
  • Median household income: $118,765
  1. Noblesville, IN
  • Population: 71,940
  • Violent crime per capita: 0.0049
  • Property crime per capita: 0.0102
  • Number of traffic deaths per 100,000 people: 4.9283
  • Number of drug overdose deaths per 100,000 people: 14.2615
  • Percentage of adults reporting excessive drinking: 20.33%
  • Median monthly housing costs: $1,511
  • Median household income: $102,319
  1. Fishers, IN
  • Population: 100,918
  • Violent crime per capita: 0.0040
  • Property crime per capita: 0.0121
  • Number of traffic deaths per 100,000 people: 4.9283
  • Number of drug overdose deaths per 100,000 people: 14.2615
  • Percentage of adults reporting excessive drinking: 20.33%
  • Median monthly housing costs: $1,701
  • Median household income: $128,141
  1. Highland Park, IL
  • Population: 30,229
  • Violent crime per capita: 0.0007
  • Property crime per capita: 0.0116
  • Number of traffic deaths per 100,000 people: 7.5845
  • Number of drug overdose deaths per 100,000 people: 18.3540
  • Percentage of adults reporting excessive drinking: 19.51%
  • Median monthly housing costs: $2,700
  • Median household income: $161,875
  1. Carmel, IN
  • Population: 100,501
  • Violent crime per capita: 0.0040
  • Property crime per capita: 0.0164
  • Number of traffic deaths per 100,000 people: 4.9283
  • Number of drug overdose deaths per 100,000 people: 14.2615
  • Percentage of adults reporting excessive drinking: 20.33%
  • Median monthly housing costs: $1,735
  • Median household income: $134,602
  1. Lexington, MA
  • Population: 34,085
  • Violent crime per capita: 0.0013
  • Property crime per capita: 0.0075
  • Number of traffic deaths per 100,000 people: 4.0318
  • Number of drug overdose deaths per 100,000 people: 24.3327
  • Percentage of adults reporting excessive drinking: 20.70%
  • Median monthly housing costs: $3,508
  • Median household income: $219,402
  1. Brownsburg, IN
  • Population: 30,310
  • Violent crime per capita: 0.0059
  • Property crime per capita: 0.0136
  • Number of traffic deaths per 100,000 people: 7.3532
  • Number of drug overdose deaths per 100,000 people: 25.6008
  • Percentage of adults reporting excessive drinking: 17.72%
  • Median monthly housing costs: $1,372
  • Median household income: $105,435
  1. Fort Lee, NJ
  • Population: 39,818
  • Violent crime per capita: 0.0076
  • Property crime per capita: 0.0262
  • Number of traffic deaths per 100,000 people: 4.3982
  • Number of drug overdose deaths per 100,000 people: 19.2795
  • Percentage of adults reporting excessive drinking: 18.52%
  • Median monthly housing costs: $2,055
  • Median household income: $105,535
  1. Spring, TX
  • Population: 67,103
  • Violent crime per capita: 0.0028
  • Property crime per capita: 0.0150
  • Number of traffic deaths per 100,000 people: 11.6254
  • Number of drug overdose deaths per 100,000 people: 21.3867
  • Percentage of adults reporting excessive drinking: 17.41%
  • Median monthly housing costs: $1,583
  • Median household income: $86,888
  1. Canton, GA
  • Population: 34,587
  • Violent crime per capita: 0.0069
  • Property crime per capita: 0.0141
  • Number of traffic deaths per 100,000 people: 8.3363
  • Number of drug overdose deaths per 100,000 people: 20.4587
  • Percentage of adults reporting excessive drinking: 18.43%
  • Median monthly housing costs: $1,499
  • Median household income: $81,642

Data and Methodology

To find the safest suburbs, SmartAsset compared data for 360 places that are within 15 to 45 minutes of the 100 largest U.S. cities by car, that have at least 5,000 residents, by the following metrics:

  • Violent crime rate. The number of violent crimes per 100,000 residents. Data comes from the FBI’s 2023 Uniform Crime Reporting Database; missing crime data was supplemented by NeighborhoodScout.com
  • Property crime rate. The number of property crimes per 100,000 residents. Data comes from the FBI’s 2023 Uniform Crime Reporting Database; missing crime data was supplemented by NeighborhoodScout.com
  • Vehicular mortality rate. The number of deaths due to traffic accidents per 100,000 residents. Data is from the 2025 County Health Rankings.
  • Drug poisoning mortality rate. The number of drug poisoning deaths per 100,000 residents. Data is from the 2025 County Health Rankings.
  • Percentage of the population engaging in excessive drinking. The percentage of adults who report binge or heavy drinking. Data is from the 2025 County Health Rankings.

The vehicular mortality rate, drug poisoning mortality rate, and percentage of the population engaging in excessive drinking are all measured at the county level. Violent and property crime rates are at the city level.

Housing affordability and local incomes were also considered:

  • Median monthly housing costs. Data comes from the Census Bureau’s 5-year American Community Survey from 2023.
  • Median household income. Data comes from the Census Bureau’s 5-year American Community Survey from 2023.

This story was produced by SmartAsset and reviewed and distributed by Stacker.


Salem News Channel Today

Sponsored Links


September 26 - Phoenix, AZ
Scottsdale Center for the Performing Arts


November 2 - Detroit, MI
Zion Christian Church in Troy


October 6 - Los Angeles, CA
Pasadena Convention Center


November 5 - San Antonio, TX
Norris Centers – The Grand Red Oak Ballroom


October 8 - Sacramento, CA
William Jessup University


November 7 - Tampa, FL
The Palladium at St. Pete College


October 22 - Minneapolis, MN
Crowne Plaza AiRE


November 15 - San Francisco, CA
Fremont Marriott Silicon Valley


October 23 - Philadelphia, PA
Green Valley Country Club


November 16 - Denver, CO
CU South Denver - Formerly Wildlife Experience


November 2 - Chicago, IL
Chicago Westin Northwest in Itasca


November 21 - Cleveland, OH
Holiday Inn Rockside in Independence


Salem Radio Network Speakers

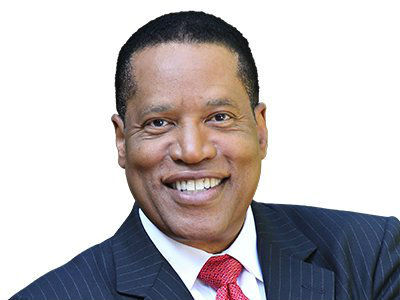
Larry Elder is an American lawyer, writer, and radio and television personality who calls himself the "Sage of South Central" a district of Los Angeles, Larry says his philosophy is to entertain, inform, provoke and to hopefully uplift. His calling card is "we have a country to save" and to him this means returning to the bedrock Constitutional principles of limited government and maximum personal responsibility. Elder's iconoclastic wit and intellectual agility makes him a particularly attractive voice in a nation that seems weary of traditional racial dialogue.” – Los Angeles Times.

Mike Gallagher Mike Gallagher began his broadcasting career in 1978 in Dayton, Ohio. Today, he is one of the most listened-to talk radio show hosts in America, recently having been ranked in the Talkers Magazine “Heavy Hundred” list – the 100 most important talk radio hosts in America. Prior to being launched into national syndication in 1998, Mike hosted the morning show on WABC-AM in New York City. Today, Talkers Magazine reports that his show is heard by over 3.75 million weekly listeners. Besides his radio work, Mike is seen on Fox News Channel as an on-air contributor, frequently appearing on the cable news giant.

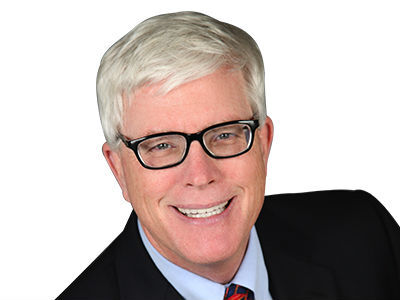
Hugh Hewitt is one of the nation’s leading bloggers and a genuine media revolutionary. He brings that expertise, his wit and what The New Yorker magazine calls his “amiable but relentless manner” to his nationally syndicated show each day.

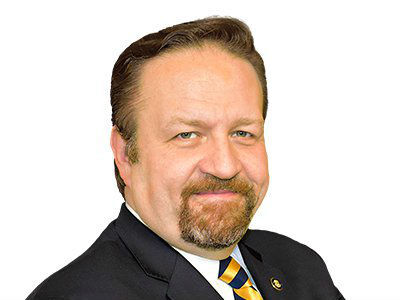
When Dr. Sebastian Gorka was growing up, he listened to talk radio under his pillow with a transistor radio, dreaming that one day he would be behind the microphone. Beginning New Year’s Day 2019, he got his wish. Gorka now hosts America First every weekday afternoon 3 to 6pm ET. Gorka’s unique story works well on the radio. He is national security analyst for the Fox News Channel and author of two books: "Why We Fight" and "Defeating Jihad." His latest book releasing this fall is “War For America’s Soul.” He is uniquely qualified to fight the culture war and stand up for what is great about America, his adopted home country.

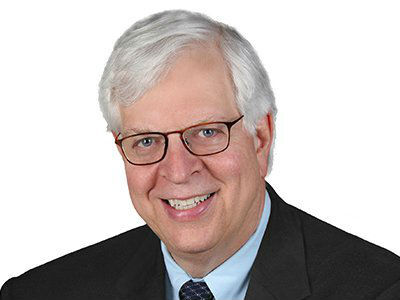
Broadcasting from his home station of KRLA in Los Angeles, the Dennis Prager Show is heard across the country. Everything in life – from politics to religion to relationships – is grist for Dennis’ mill. If it’s interesting, if it affects your life, then Dennis will be talking about it – with passion, humor, insight and wisdom.

Sean Hannity is a conservative radio and television host, and one of the original primetime hosts on the Fox News Channel, where he has appeared since 1996. Sean Hannity began his radio career at a college station in California, before moving on to markets in the Southeast and New York. Today, he’s one of the most listened to on-air voices. Hannity’s radio program went into national syndication on September 10, 2001, and airs on more than 500 stations. Talkers Magazine estimates Hannity’s weekly radio audience at 13.5 million. In 1996 he was hired as one of the original hosts on Fox News Channel. As host of several popular Fox programs, Hannity has become the highest-paid news anchor on television.

Michelle Malkin is a mother, wife, blogger, conservative syndicated columnist, longtime cable TV news commentator, and best-selling author of six books. She started her newspaper journalism career at the Los Angeles Daily News in 1992, moved to the Seattle Times in 1995, and has been penning nationally syndicated newspaper columns for Creators Syndicate since 1999. She is founder of conservative Internet start-ups Hot Air and Twitchy.com. Malkin has received numerous awards for her investigative journalism, including the Council on Governmental Ethics Laws (COGEL) national award for outstanding service for the cause of governmental ethics and leadership (1998), the Reed Irvine Accuracy in Media Award for Investigative Journalism (2006), the Heritage Foundation and Franklin Center for Government & Public Integrity's Breitbart Award for Excellence in Journalism (2013), the Center for Immigration Studies' Eugene Katz Award for Excellence in the Coverage of Immigration Award (2016), and the Manhattan Film Festival's Film Heals Award (2018). Married for 26 years and the mother of two teenage children, she lives with her family in Colorado. Follow her at michellemalkin.com. (Photo reprinted with kind permission from Peter Duke Photography.)

Sponsored by:

America's safest suburbs ranked for 2025

Carbonatix Pre-Player Loader

Audio By Carbonatix

America's safest suburbs ranked for 2025

While costs are often a major factor for families deciding where to settle, safety is another important factor for quality of life. Many households are willing to pay a premium to be in a neighborhood they feel physically safe in, as valuable qualitative benefits may be at stake in establishing a sense of safety — particularly for families with children. But safety trends can change due to economic, legislative, and other factors. For instance, year over year, the median number of violent crimes in the suburbs increased from 198 to 231, while the median number of property crimes across those same suburbs decreased from 733 to 706.

With this in mind, SmartAsset ranked 360 U.S. towns within 45 minutes driving distance of a major city based on the rates of violent crime, property crime, drug overdoses, traffic deaths, and excessive drinking to determine America’s safest suburbs.

Key Findings

  • Lehi, UT ranks as the safest suburb for the second year in a row. Only 9.4% of adults report excessive drinking in Lehi, the only suburb where this figure is less than 10%. Lehi also has the 22nd lowest rate of drug overdose deaths, and ranks relatively well across other safety metrics. The median monthly housing payment in Lehi is $1,881, compared to $125,860 in household income. On the opposite end of Salt Lake City, Layton, UT ranked the 7th safest suburb. Housing is more affordable in Layton at $1,524 per month, but median household income is also lower at $99,188.
  • Two Dallas suburbs earn spots among the top 10. McKinney and Frisco ranked as the 9th and 10th safest suburbs, respectively. Both located in Collins County, they have some of the lowest drug overdose death rates studywide, and also score particularly well for crime. In McKinney, the median monthly housing payment is $2,101, compared to a median household income of $120,273. In Frisco, the figures are slightly higher with median housing payments at $2,389 and household incomes at $146,158.
  • These midwestern suburbs have the lowest crime rates. Scottsburg, IN was the only suburb with no reported violent crimes, and only 10 property crimes were reported by its 7,338 residents. Canal Winchester, OH had the second lowest rate of violent crime with one incident among 9,659 residents, and it also boasted the lowest rate for property crime overall with six reported incidents. Gretna, NE had the third lowest rate of violent crime, with two incidents reported across 9,117 people.
  • Des Moines, IA suburbs have the lowest rate of drug overdose deaths. Compared to the study-wide median of 26.6 drug overdose deaths per 100,000 residents, towns like Ames, IA, report a fraction of that at a rate of 7.7. In Ames, the median monthly housing cost is $1,082, compared to a median household income of $60,102.
  • Boston and New York City suburbs have the lowest traffic deaths. Stop-and-go traffic does have some benefits. Despite wait times getting in and out of the nearby city center, Lexington and Somerville in Middlesex County, MA report an average of 4 vehicular accident deaths per 100,000 people. Similarly, in Hoboken, Edgewater, and Fort Lee, NJ, that figure is 4.4. For comparison, median traffic deaths across 360 suburbs were 10.8 per 100,000 residents.
SmartAsset's ranking of the top suburbs in America where it is the safest.
SmartAsset


Top 20 Safest Suburbs

  1. Lehi, UT
  • Population: 81,039
  • Violent crime per capita: 0.0072
  • Property crime per capita: 0.0158
  • Number of traffic deaths per 100,000 people: 5.6054
  • Number of drug overdose deaths per 100,000 people: 11.8716
  • Percentage of adults reporting excessive drinking: 9.39%
  • Median monthly housing costs: $1,881
  • Median household income: $125,860
  1. Bethesda, MD
  • Population: 67,403
  • Violent crime per capita: 0.0014
  • Property crime per capita: 0.0197
  • Number of traffic deaths per 100,000 people: 5.6211
  • Number of drug overdose deaths per 100,000 people: 14.2443
  • Percentage of adults reporting excessive drinking: 15.28%
  • Median monthly housing costs: $2,848
  • Median household income: $191,348
  1. Great Falls, VA
  • Population: 14,854
  • Violent crime per capita: 0.0004
  • Property crime per capita: 0.0032
  • Number of traffic deaths per 100,000 people: 4.3547
  • Number of drug overdose deaths per 100,000 people: 10.5282
  • Percentage of adults reporting excessive drinking: 18.78%
  • Median monthly housing costs: 4000+
  • Median household income: 250000+
  1. Rockville, MD
  • Population: 67,218
  • Violent crime per capita: 0.0064
  • Property crime per capita: 0.0198
  • Number of traffic deaths per 100,000 people: 5.6211
  • Number of drug overdose deaths per 100,000 people: 14.2443
  • Percentage of adults reporting excessive drinking: 15.28%
  • Median monthly housing costs: $2,262
  • Median household income: $122,384
  1. Dacula, GA
  • Population: 7,135
  • Violent crime per capita: 0.0017
  • Property crime per capita: 0.0062
  • Number of traffic deaths per 100,000 people: 9.3399
  • Number of drug overdose deaths per 100,000 people: 16.0970
  • Percentage of adults reporting excessive drinking: 16.16%
  • Median monthly housing costs: $1,547
  • Median household income: $74,900
  1. Buford, GA
  • Population: 17,611
  • Violent crime per capita: 0.0028
  • Property crime per capita: 0.0092
  • Number of traffic deaths per 100,000 people: 9.3399
  • Number of drug overdose deaths per 100,000 people: 16.0970
  • Percentage of adults reporting excessive drinking: 16.16%
  • Median monthly housing costs: $1,300
  • Median household income: $71,598
  1. Layton, UT
  • Population: 82,512
  • Violent crime per capita: 0.0126
  • Property crime per capita: 0.0267
  • Number of traffic deaths per 100,000 people: 6.4967
  • Number of drug overdose deaths per 100,000 people: 17.2372
  • Percentage of adults reporting excessive drinking: 13.77%
  • Median monthly housing costs: $1,524
  • Median household income: $99,188
  1. Edgewater, NJ
  • Population: 14,544
  • Violent crime per capita: 0.0006
  • Property crime per capita: 0.0142
  • Number of traffic deaths per 100,000 people: 4.3982
  • Number of drug overdose deaths per 100,000 people: 19.2795
  • Percentage of adults reporting excessive drinking: 18.52%
  • Median monthly housing costs: $2,769
  • Median household income: $137,847
  1. McKinney, TX
  • Population: 202,314
  • Violent crime per capita: 0.0059
  • Property crime per capita: 0.0152
  • Number of traffic deaths per 100,000 people: 6.8868
  • Number of drug overdose deaths per 100,000 people: 10.0592
  • Percentage of adults reporting excessive drinking: 18.21%
  • Median monthly housing costs: $2,101
  • Median household income: $120,273
  1. Frisco, TX
  • Population: 210,238
  • Violent crime per capita: 0.0052
  • Property crime per capita: 0.0215
  • Number of traffic deaths per 100,000 people: 6.8868
  • Number of drug overdose deaths per 100,000 people: 10.0592
  • Percentage of adults reporting excessive drinking: 18.21%
  • Median monthly housing costs: $2,389
  • Median household income: $146,158
  1. Gretna, NE
  • Population: 9,117
  • Violent crime per capita: 0.0002
  • Property crime per capita: 0.0060
  • Number of traffic deaths per 100,000 people: 8.1621
  • Number of drug overdose deaths per 100,000 people: 7.9471
  • Percentage of adults reporting excessive drinking: 21.09%
  • Median monthly housing costs: $1,677
  • Median household income: $118,765
  1. Noblesville, IN
  • Population: 71,940
  • Violent crime per capita: 0.0049
  • Property crime per capita: 0.0102
  • Number of traffic deaths per 100,000 people: 4.9283
  • Number of drug overdose deaths per 100,000 people: 14.2615
  • Percentage of adults reporting excessive drinking: 20.33%
  • Median monthly housing costs: $1,511
  • Median household income: $102,319
  1. Fishers, IN
  • Population: 100,918
  • Violent crime per capita: 0.0040
  • Property crime per capita: 0.0121
  • Number of traffic deaths per 100,000 people: 4.9283
  • Number of drug overdose deaths per 100,000 people: 14.2615
  • Percentage of adults reporting excessive drinking: 20.33%
  • Median monthly housing costs: $1,701
  • Median household income: $128,141
  1. Highland Park, IL
  • Population: 30,229
  • Violent crime per capita: 0.0007
  • Property crime per capita: 0.0116
  • Number of traffic deaths per 100,000 people: 7.5845
  • Number of drug overdose deaths per 100,000 people: 18.3540
  • Percentage of adults reporting excessive drinking: 19.51%
  • Median monthly housing costs: $2,700
  • Median household income: $161,875
  1. Carmel, IN
  • Population: 100,501
  • Violent crime per capita: 0.0040
  • Property crime per capita: 0.0164
  • Number of traffic deaths per 100,000 people: 4.9283
  • Number of drug overdose deaths per 100,000 people: 14.2615
  • Percentage of adults reporting excessive drinking: 20.33%
  • Median monthly housing costs: $1,735
  • Median household income: $134,602
  1. Lexington, MA
  • Population: 34,085
  • Violent crime per capita: 0.0013
  • Property crime per capita: 0.0075
  • Number of traffic deaths per 100,000 people: 4.0318
  • Number of drug overdose deaths per 100,000 people: 24.3327
  • Percentage of adults reporting excessive drinking: 20.70%
  • Median monthly housing costs: $3,508
  • Median household income: $219,402
  1. Brownsburg, IN
  • Population: 30,310
  • Violent crime per capita: 0.0059
  • Property crime per capita: 0.0136
  • Number of traffic deaths per 100,000 people: 7.3532
  • Number of drug overdose deaths per 100,000 people: 25.6008
  • Percentage of adults reporting excessive drinking: 17.72%
  • Median monthly housing costs: $1,372
  • Median household income: $105,435
  1. Fort Lee, NJ
  • Population: 39,818
  • Violent crime per capita: 0.0076
  • Property crime per capita: 0.0262
  • Number of traffic deaths per 100,000 people: 4.3982
  • Number of drug overdose deaths per 100,000 people: 19.2795
  • Percentage of adults reporting excessive drinking: 18.52%
  • Median monthly housing costs: $2,055
  • Median household income: $105,535
  1. Spring, TX
  • Population: 67,103
  • Violent crime per capita: 0.0028
  • Property crime per capita: 0.0150
  • Number of traffic deaths per 100,000 people: 11.6254
  • Number of drug overdose deaths per 100,000 people: 21.3867
  • Percentage of adults reporting excessive drinking: 17.41%
  • Median monthly housing costs: $1,583
  • Median household income: $86,888
  1. Canton, GA
  • Population: 34,587
  • Violent crime per capita: 0.0069
  • Property crime per capita: 0.0141
  • Number of traffic deaths per 100,000 people: 8.3363
  • Number of drug overdose deaths per 100,000 people: 20.4587
  • Percentage of adults reporting excessive drinking: 18.43%
  • Median monthly housing costs: $1,499
  • Median household income: $81,642

Data and Methodology

To find the safest suburbs, SmartAsset compared data for 360 places that are within 15 to 45 minutes of the 100 largest U.S. cities by car, that have at least 5,000 residents, by the following metrics:

  • Violent crime rate. The number of violent crimes per 100,000 residents. Data comes from the FBI’s 2023 Uniform Crime Reporting Database; missing crime data was supplemented by NeighborhoodScout.com
  • Property crime rate. The number of property crimes per 100,000 residents. Data comes from the FBI’s 2023 Uniform Crime Reporting Database; missing crime data was supplemented by NeighborhoodScout.com
  • Vehicular mortality rate. The number of deaths due to traffic accidents per 100,000 residents. Data is from the 2025 County Health Rankings.
  • Drug poisoning mortality rate. The number of drug poisoning deaths per 100,000 residents. Data is from the 2025 County Health Rankings.
  • Percentage of the population engaging in excessive drinking. The percentage of adults who report binge or heavy drinking. Data is from the 2025 County Health Rankings.

The vehicular mortality rate, drug poisoning mortality rate, and percentage of the population engaging in excessive drinking are all measured at the county level. Violent and property crime rates are at the city level.

Housing affordability and local incomes were also considered:

  • Median monthly housing costs. Data comes from the Census Bureau’s 5-year American Community Survey from 2023.
  • Median household income. Data comes from the Census Bureau’s 5-year American Community Survey from 2023.

This story was produced by SmartAsset and reviewed and distributed by Stacker.


Salem News Channel Today

Sponsored Links

On Air & Up Next

See the Full Program Guide