How a hotter summer changes the cost of cooling your home
Lifestyle

Audio By Carbonatix
9:30 AM on Tuesday, June 2
By Seth Nenstiel for Shipley Energy, Stacker
How a hotter summer changes the cost of cooling your home
Air conditioning accounts for roughly 19% of annual household electricity use in the United States, according to the U.S. Energy Information Administration. While that share of energy usage has stayed consistent for years, what has changed is how hard cooling systems have to work.
An analysis of 25 years of federal climate data from the National Oceanic and Atmospheric Administration, conducted by Shipley Energy, shows that cooling degree days have increased in 45 of 48 contiguous states since the early 2000s. The increases are not evenly distributed across the state or region. Some states are accumulating hundreds of additional cooling degree days each year, while a handful have held relatively steady. The result is a widening gap in what American households pay to stay comfortable during summer, while electricity bills are climbing, and the lifespan of the equipment cooling Americans is decreasing.
This analysis uses monthly cooling degree day data from NOAA’s Climate Prediction Center and NOAA’s National Centers for Environmental Information, combined with state electricity rates from the EIA’s 2024 State Electricity Profiles, to measure how cooling demand has shifted across all four Census regions covering the lower 48 states, and estimates what that shift costs the average household in both energy and equipment wear.
What are cooling degree days?
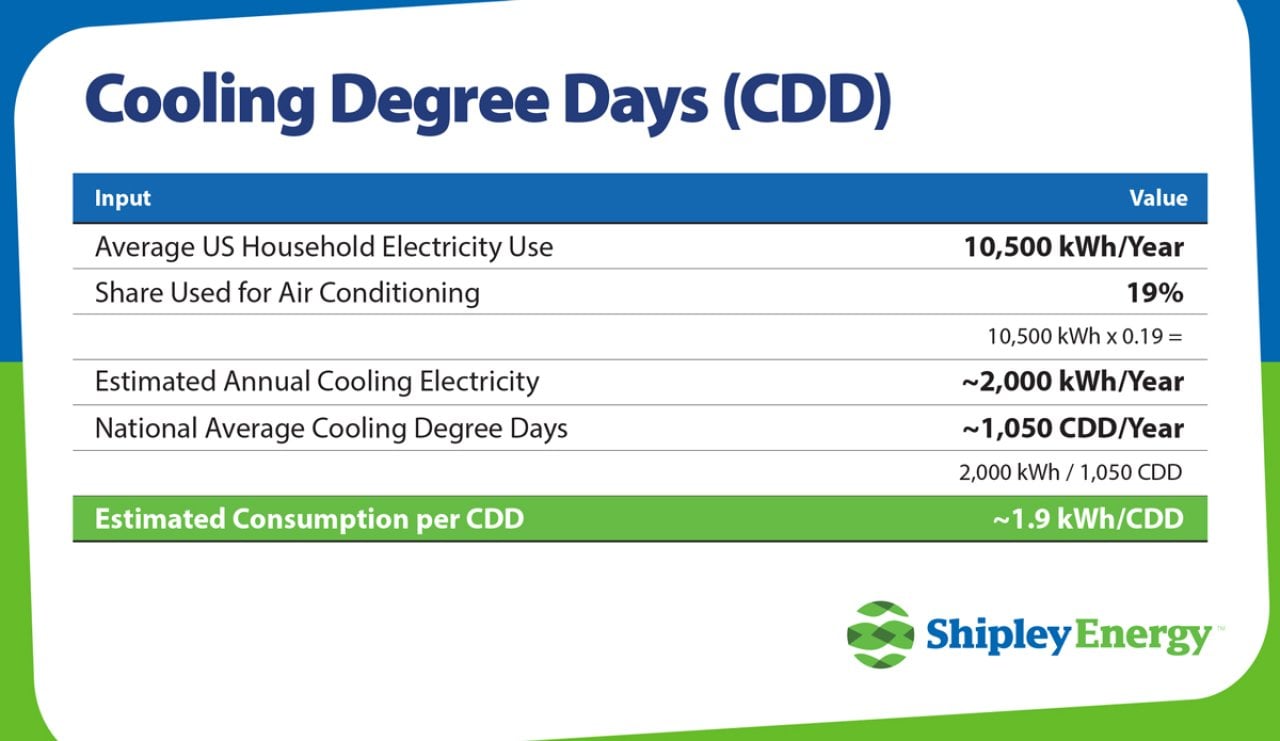
A cooling degree day is the standard metric utilities and climate scientists use to quantify cooling demand, and is measured by how much the average outdoor temperature exceeds 65 F, the temperature at which most buildings begin to require cooling. If the average temperature on a particular day is 85 F, that day registers 20 cooling degree days (CDDs), while a day averaging 60 F registers zero CDDs.
Annual cooling degree days are then the sum of the daily values across an entire year. The higher a state’s annual CDD total, the more hours homeowners run air conditioning systems, consuming more electricity, and causing more mechanical wear on their systems. As a rough benchmark, each additional cooling degree day adds approximately 2 kilowatt-hours of electricity consumption for a typical household running a 2.5-ton central air conditioner at a SEER 14 efficiency rating.
When CDD totals rise year over year, it means summers are either getting hotter, lasting longer, or both. This leads to higher utility bills and shorter intervals between equipment replacements.
How much has cooling demand increased across the country?
Comparing five-year averages for 2001-2005 versus 2021-2025 helps to smooth out individual hot or cool years and reveals the underlying trend. Across the four U.S. Census regions, the pattern is consistent: cooling demand is up everywhere, though the South is absorbing the largest increases in absolute terms.
A separate analysis by Climate Central found that annual cooling degree days have increased since 1970 in 232 of 240 U.S. locations studied, covering 97% of the areas examined. The findings here, using a different time window and methodology, broadly align: 45 of 48 contiguous states show higher average CDD totals in the most recent five-year period compared to the early 2000s.
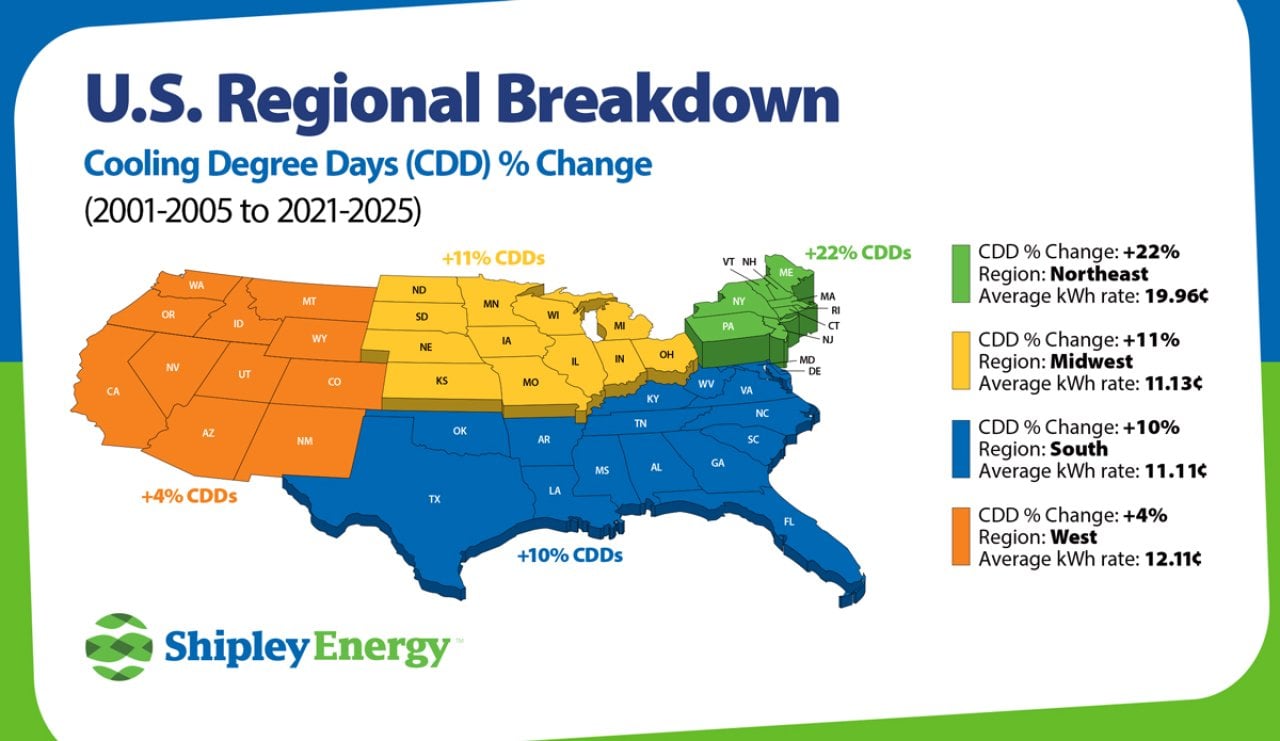
The regional breakdown:
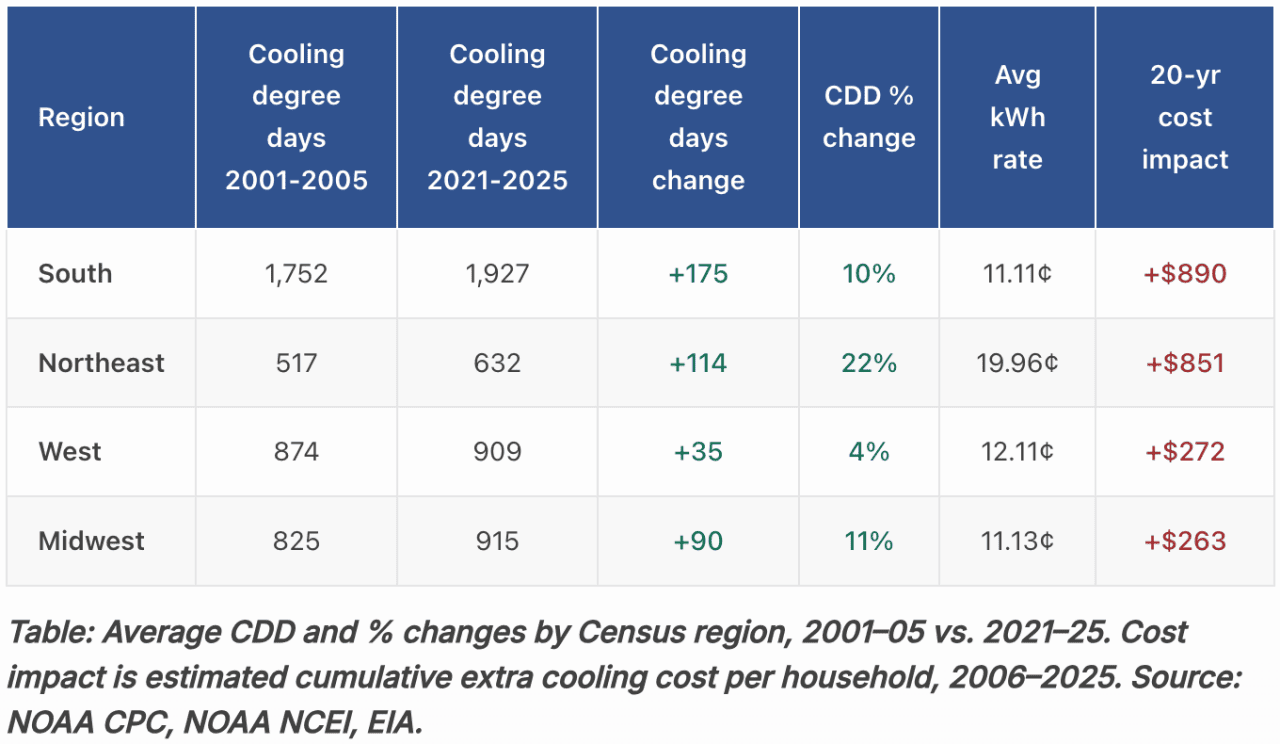
The South region leads in raw CDD growth, gaining an average of 175 cooling degree days per state. The Northeast gained fewer degree days in absolute terms (+114) but is seeing the fastest proportional increase, and its high electricity rates amplify every additional degree day.
The Midwest sits in the middle with moderate increases (+90 CDD) and relatively affordable electricity. The West shows the smallest average gain (+35), but that number masks a wide split: Desert states like Arizona and Nevada have actually seen CDD declines in the population-weighted data, while Pacific Northwest states like Oregon and Washington are posting some of the steepest increases in the country.
Which states are seeing the biggest increases?
Texas leads all states with a 427-CDD increase between the 2001-2005 and 2021-2025 periods, averaging a gain of nearly 20 cooling degree days per year. Mississippi (+274), Arkansas (+234), Utah (+229), and Oregon (+227) round out the top five. Several of these may surprise readers, Utah and Oregon are not states typically associated with intense cooling demand, but both have seen sustained warming that is pushing their CDD totals well above historical norms.
Three states, Nevada (-433), Arizona (-347), and New Mexico (-89), bucked the trend with lower CDD averages in the most recent period. These are still among the hottest states in the country by total cooling degree days. The decline is likely a data quirk: the federal dataset weights readings by where people live, and rapid suburban growth in cooler parts of those states can pull the statewide average down even when temperatures at individual locations haven’t changed.
For homeowners, the trend line matters as much as the current total. A state like New York, which added 154 cooling degree days over the period, went from an average household that barely needed AC in May or September to one where those shoulder months now regularly register measurable cooling demand. That kind of shift means AC systems are starting earlier in spring and running later into fall, adding runtime that compounds year after year.
How much is this adding to household electricity bills?
Cooling degree day increases become a dollar figure when multiplied by two variables: how much electricity each degree day requires (approximately 2 kWh for a typical household) and what that electricity costs in a given state. The interaction between those factors reshuffles the state rankings in ways that raw CDD data alone does not predict.
As cooling degree days increase, homeowners across the country have seen electricity bill increases between $28 and $84 annually.
The 15 states with the highest estimated cumulative household cooling cost impact over the 2006-2025 period:
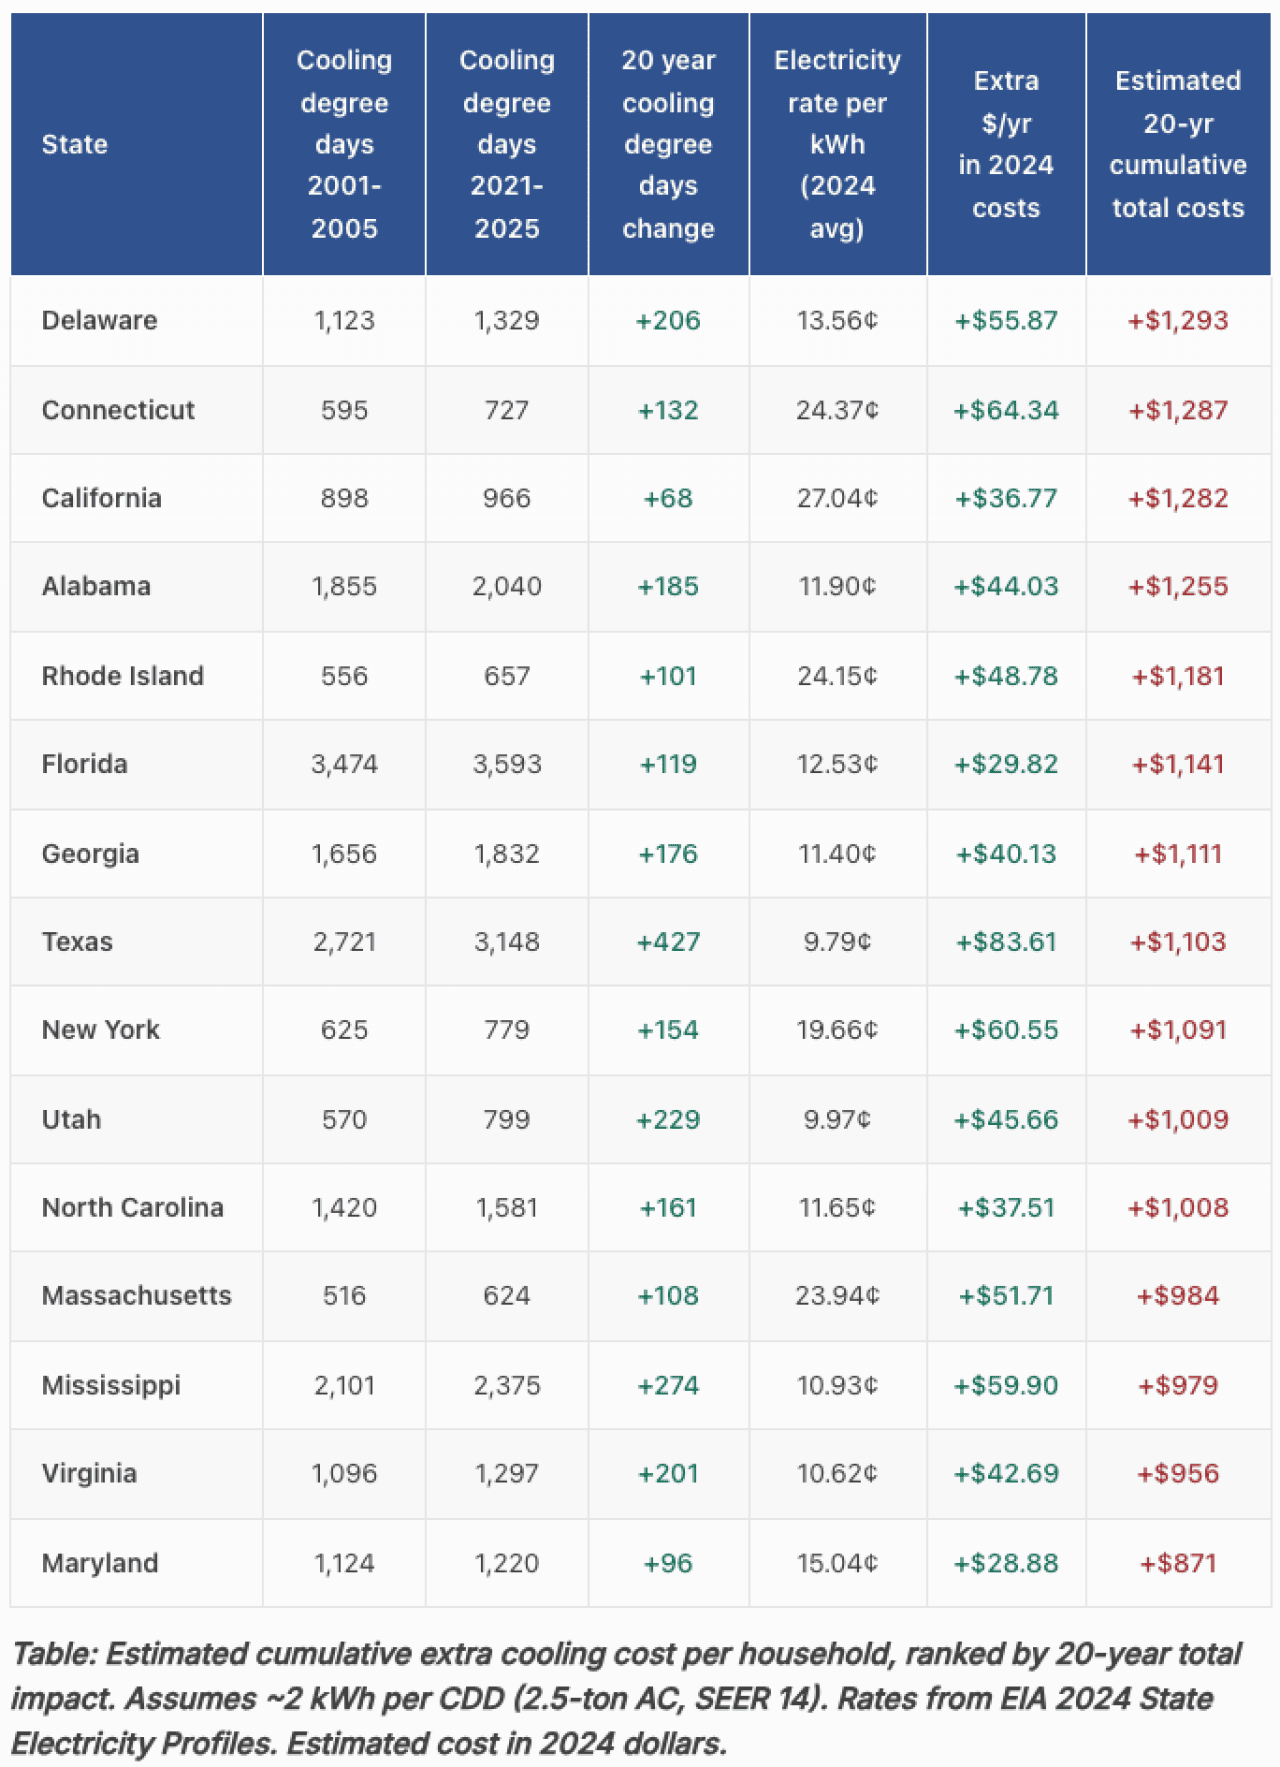
Delaware tops the list at an estimated $1,293 in cumulative extra cooling costs over 20 years, despite ranking only sixth in raw CDD growth. Its 13.56 cents/kWh electricity rate, combined with a 206-CDD increase, produces a larger dollar impact than many hotter states with cheaper power. Connecticut ($1,287) and California ($1,282) follow, driven almost entirely by their electricity rates of 24.37 cents and 27.04 cents, respectively. California added just 68 cooling degree days over the period, but each one costs more than twice as much to cool through as a degree day in Texas.
Texas, despite having the single largest CDD increase of any state (+427) and the highest current annual cost adder (+$83.61/year per household), lands eighth in cumulative impact because its 9.79 cents rate limits the per-degree-day cost. New Hampshire, which most people do not associate with air conditioning costs, ranks 16th; its 20.61 cents rate means each of its 158 additional cooling degree days costs 41 cents per household, more than double what the same degree day costs in Arkansas.
How do rising CDDs affect the lifespan of a central air conditioner?
The electricity bill is the visible cost. The less visible one is what all that additional runtime does to the equipment. Major HVAC manufacturers, including Carrier and Trane, cite a typical central air conditioner lifespan of 15 to 20 years, with climate and usage as the primary variables that determine where a given unit falls in that range.
Carrier notes the distinction directly: An AC system in a northern climate with moderately warm summers will accumulate fewer hours in service and fewer start-and-stop cycles than a unit installed in a warmer and more humid climate. That difference, compounded over a decade or more, translates into meaningfully different replacement timelines by region.
Mapped against the CDD data:
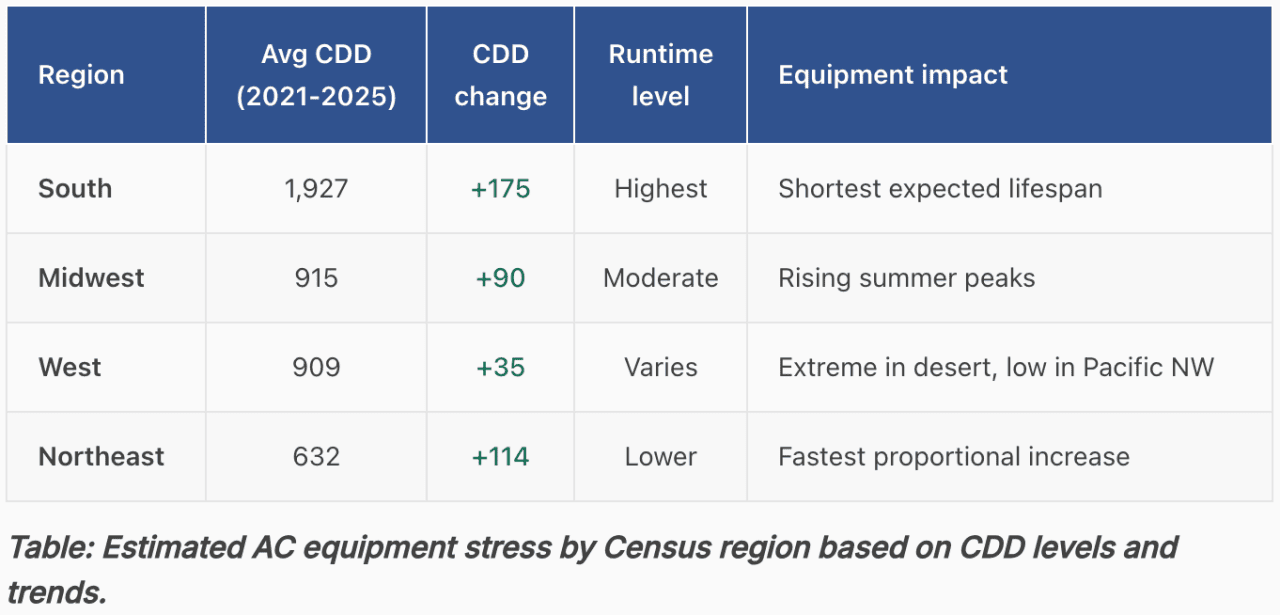
A household in the South running nearly 1,930 cooling degree days per year is putting roughly three times the cooling workload on its compressor as a household in the Northeast at 632 CDD. That gap has widened by 175 degree days over the past two decades in the South alone. For homeowners in the highest-CDD states like Florida, Texas, Louisiana, and Mississippi, the practical result is that AC units that might have lasted 18 years in the early 2000s are now running harder every summer and wearing out faster.
The replacement cost context makes this more than an inconvenience. A new central air conditioner installation averages $5,750 for a standard 3-ton unit, with the full range running $3,300 to $7,800 depending on efficiency rating, installation complexity, and region, according to 2025 industry pricing data. Higher-efficiency units with SEER ratings of 16 or above cost more upfront but consume less electricity per cooling degree day, which increasingly matters as CDD totals continue to climb.
If the current CDD trend holds, homeowners in the South may face an additional full AC replacement cycle over a 30-year period compared to conditions in the early 2000s, meaning homeowners should budget for an extra $5,000 to $8,000 in cooling system costs on top of the higher annual electricity bills.
What can homeowners do about rising cooling and HVAC costs?
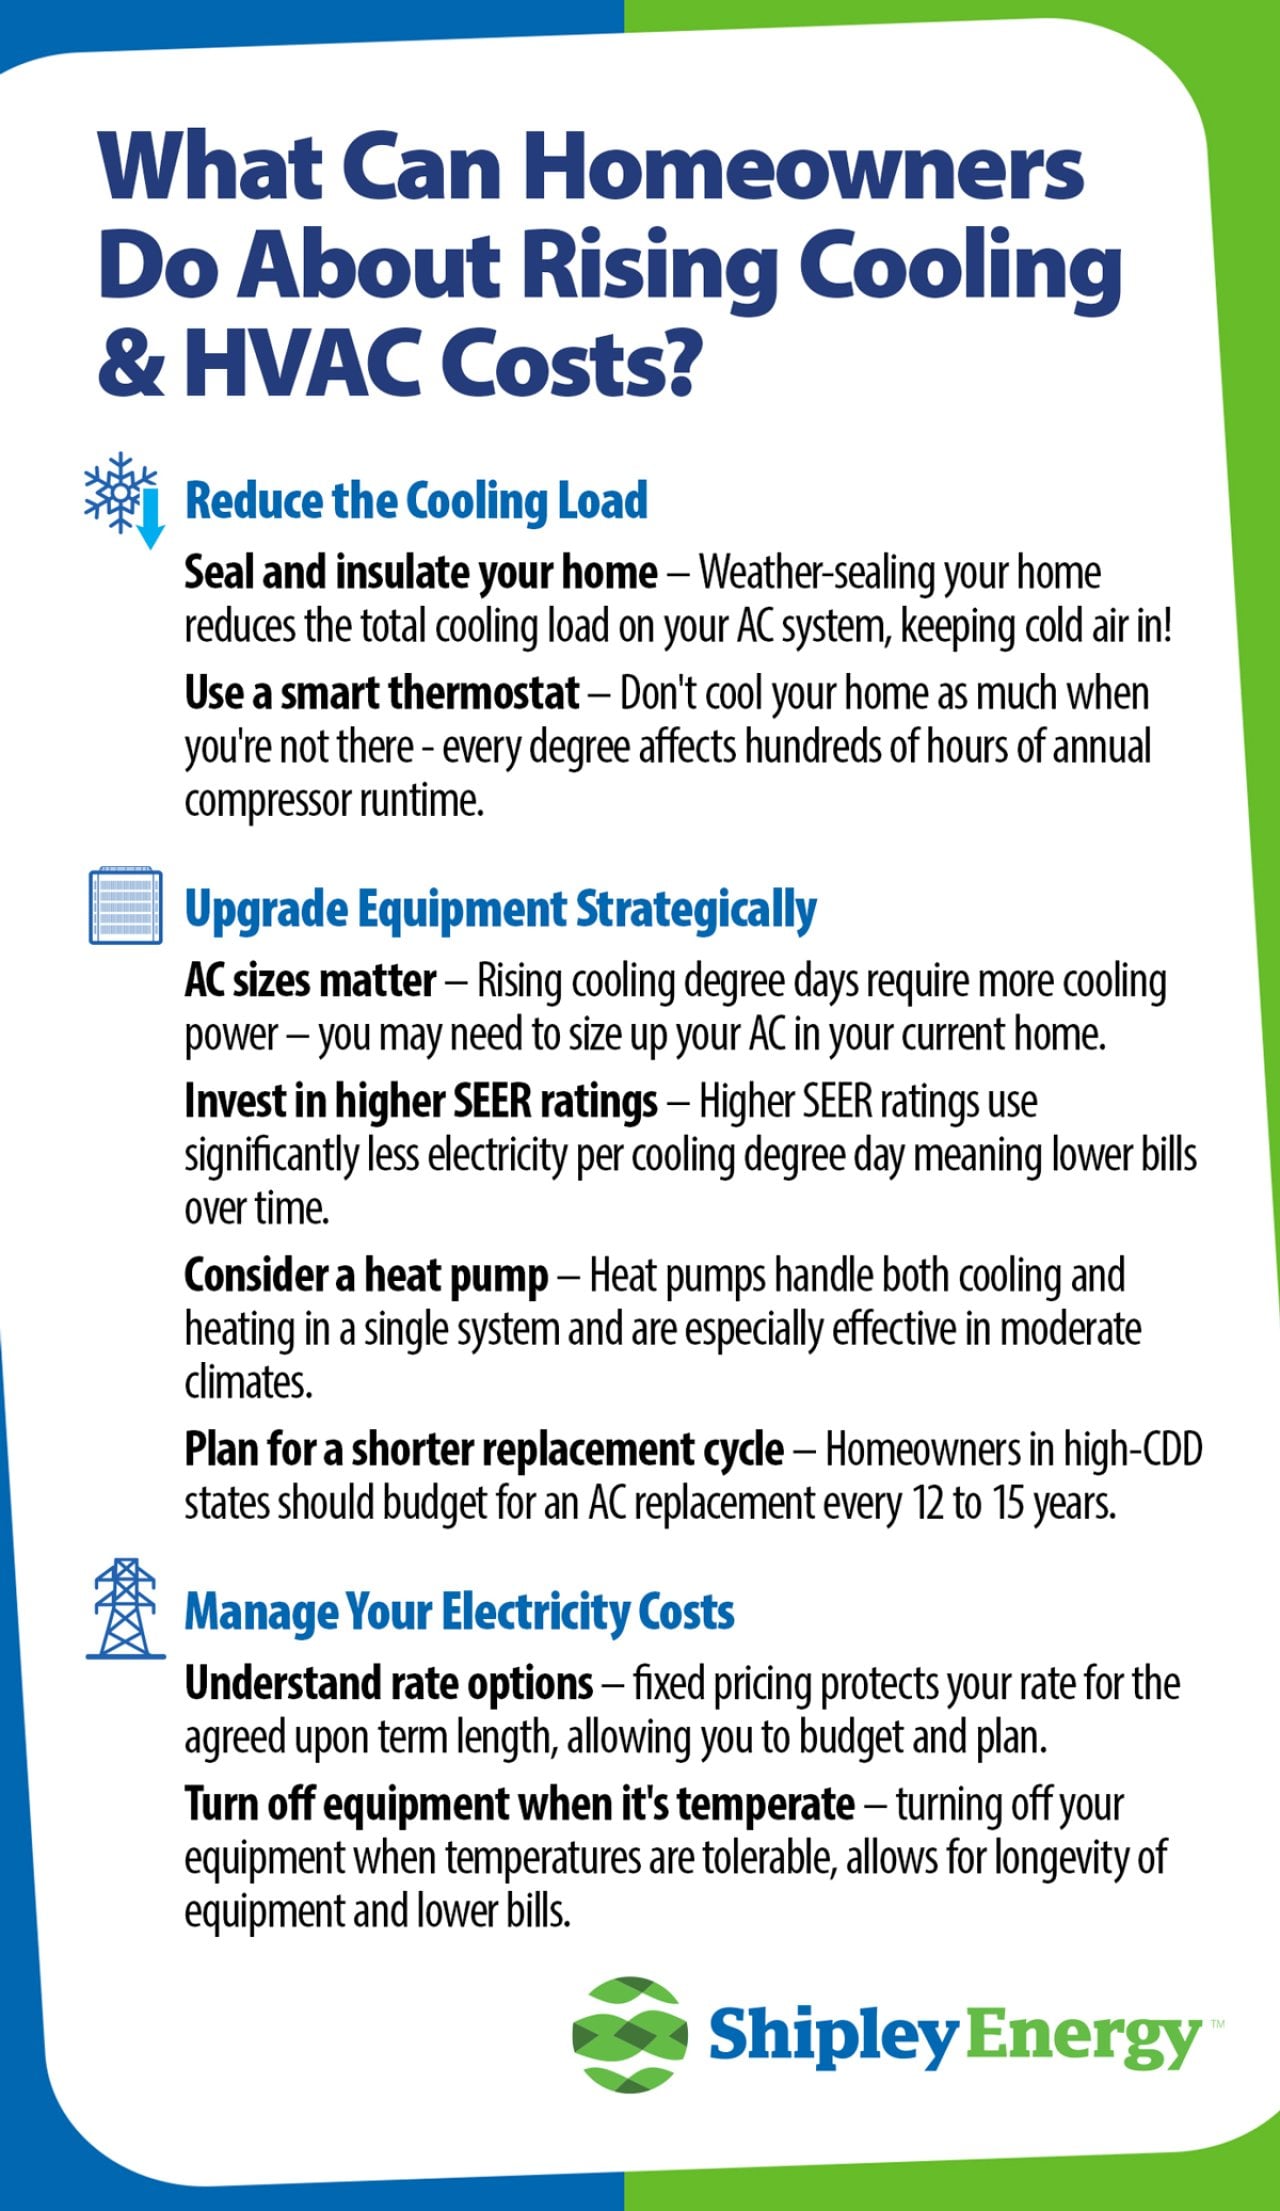
Reduce the cooling load
- Seal and insulate. Air sealing and attic insulation reduce the total cooling load your AC has to handle. A smaller load means fewer runtime hours, lower electricity consumption, and less compressor wear, regardless of how many cooling degree days accumulate outside.
- Use a programmable or smart thermostat. Avoid overcooling when the house is empty. In a high-CDD state, every degree of thermostat adjustment affects hundreds of hours of annual compressor runtime.
Upgrade equipment strategically
- Size the unit for current conditions, not historical ones. Rising cooling degree day totals mean the system a home needed in 2005 may be undersized today. An undersized unit runs constantly without reaching the set temperature, accelerating wear and increasing electricity consumption.
- Invest in higher SEER ratings. A SEER 16+ unit costs more upfront but uses significantly less electricity per cooling degree day. As annual CDD totals continue to rise, the difference in operating cost between a SEER 14 and a SEER 18 unit compounds each year.
- Consider a heat pump. Heat pumps handle both cooling and heating in a single system. In regions where CDDs are rising and heating degree days are falling simultaneously, particularly in the Northeast and South Atlantic regions, a heat pump addresses both trends.
Manage your electricity costs
- Understand your rate structure. If your utility offers time-of-use pricing, shifting AC-heavy hours to off-peak windows can reduce per-kWh costs during the times when cooling demand is highest.
- Plan for a shorter replacement cycle. Homeowners in high-CDD states should budget for an AC replacement every 12 to 15 years rather than assuming the full 20-year lifespan. A dedicated replacement fund avoids the financial shock of an emergency installation during a heat wave.
This story was produced by Shipley Energy and reviewed and distributed by Stacker.